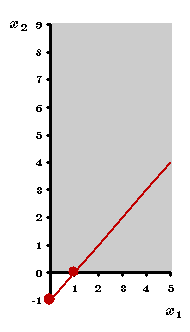

For this constraint we need to graph its constraint-boundary line. The equation for this line is
| The Graphical Method - Feasible Region | Previous | Next |
 |
 |
||
| Money Constraint: For this constraint we need to graph its constraint-boundary line. The equation for this line is |
|||
| To determine which side of the constraint boundary line is the feasible
side, we check the origin (0, 0). If |
|||
| Since (0, 0) satisfies the money constraint, the feasible side of the constraint boundary line is the side containing the origin, as shown by the shaded region in the graph. | |||