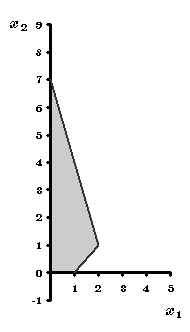

Having constructed the feasible region, we now need to find the best feasible solution, i.e., the optimal solution. We start this process by graphing the objective function line (a line giving a fixed value of
For example, notice that (1, 2) is clearly in the feasible region, and (1, 2) yields
Therefore, let us graph the objective function line for ![]() ,
i.e., the line given by the equation,
,
i.e., the line given by the equation,