Jim Whitney Economics 101

Problem Set 3: Key

BASIC ANALYSIS OF GOVERNMENT POLICIES
 

1.

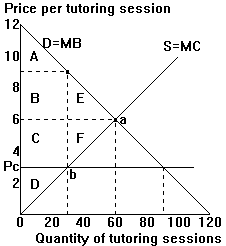
Suppose that the diagram to the right depicts the student market for tutoring services.
a. Indicate in the diagram and compute the value of consumer surplus and producer surplus.
CS = ABE = $180. PS = CDF = $180
b. Suppose that government concern over student access to tutoring services results in the imposition of a price ceiling of $3 per tutoring session. Depict the consequences of the price ceiling in the diagram. Does a surplus or shortage result? How large? Pc = 3 --> Qs = 30; Qd = 90
c. Compute the new values for consumer and producer surplus and for the welfare loss associated with the price ceiling. Indicate these areas in the diagram.
New CS = ABC = $225. New PS = $45
Welfare loss = EF =
$90
d. Comparing your answers in parts a and c, why do you think consumers might lobby for price ceilings despite the resulting inefficiency? CS rises.
 

2.

The federal government imposes a price floor in the market for dairy products. The floor is often referred to as a "support price." For dairy products, the government buys up any surplus production which occurs.
a. Illustrate the effects of a price floor for dairy products in a supply and demand diagram. Indicate in your diagram the quantity of dairy products which is bought up by the government.
b. Consider the following passage from Business Week magazine: "Says Irvin Elkin, president of the Associated Milk Producers Inc. 'Major cuts in [dairy] support prices run the risk of driving many dairy farmers out of business, which would mean higher milk prices.'" What is probably correct about Elkin's assertion? What is incorrect? Support both answers.   
    Correct: "Cuts in support prices run the risk of driving many dairy farmers out of business."
   
Incorrect: "higher milk prices." Cutting a price floor reduces Qs, but only because P falls.


3.

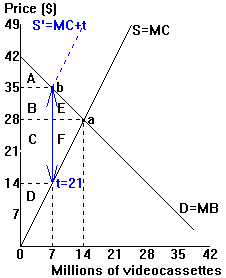
Suppose the diagram to the right shows the market for X-rated videocassettes. Suppose that the government imposes a tax of $21 on each X-rated videocassette sold.
a. Depict in the diagram: (1) the quantity marketed with the tax (Qt), (2) the price buyers pay with the tax (Pbt), and (3) the price sellers receive with the tax (Pst). See diagram to right for tax
b. Indicate in the diagram each of the following consequences of the tax and calculate the numerical value for each one: (1) the change in consumer surplus, (2) the change in producer surplus, (3) the tax revenues collected by the government, and (4) the change in social welfare.
    (1) Change in CS = -BE = -$73.5
    (2) Change in PS = -CF =
-$147
    (3) Tax revenues = BC =
+$147
    (4) Change in TS = -EF =
-$73.5


4.

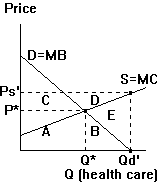
Suppose the diagram to the right depicts the market for health care services (for this problem, ignore recent health reform proposals and just consider health care to be like any ordinary product). Now suppose that the U.S. adopts a system of subsidized national health insurance in which health care services are financed by general tax revenue, and individual patients are not charged for the health care services they individually consume.
a. Indicate in the diagram: (1) the new quantity demanded of health care (hint: what is the new price paid by individual patients?) and (2) the price health care providers will have to receive to induce them to supply the new quantity demanded (hint: how high is MC at the new quantity demanded?). 
    See diagram. (1) New Q: Qd' (2) New price to sellers: Ps'
b. Indicate in the diagram each of the following consequences of the health insurance program: (1) the change in consumer surplus, (2) the change in producer surplus, and (3) the cost of the program to taxpayers.
    (1) chCS: +AB. (2) chPS: +CD. (3) cost to government: -ABCDE


5.

Mankiw, Chapter 6, Problems and Applications number 11.
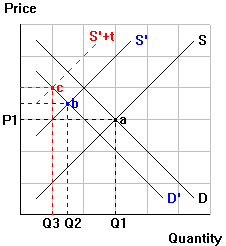
  a.  Programs aimed at making the public aware of the dangers of smoking reduce the demand for cigarettes, shown in the figure to the right as a shift from demand curve D to D'.  The price support program increases the price of tobacco, which is the main ingredient in cigarettes.  As a result, the supply of cigarettes shifts to the left, from S to S'.  The effect of both programs is to reduce the quantity of cigarette consumption from Q1 to Q2.
b.  The combined effect of the two programs on the price of cigarettes is ambiguous.  The education campaign reduces demand for cigarettes, which tends to reduce the price.  The tobacco price supports raise the cost of production of cigarettes, which tends to increase the price.
c. The taxation of cigarettes further reduces cigarette consumption, since it increases the price to consumers.  As shown in the figure, the quantity falls to Q3.
 
MARKET FAILURE
 

6.

State whether the following is true or false: Vaccinations against contagious diseases are frequently provided to school children at no charge because the vaccinations themselves can be produced at no cost. If false, then why are they provided for free?
    False. Vac. are offered at no charge because of important external benefits associated with them (they protect each child from spreading the diseases as well as from getting them).
 

7.

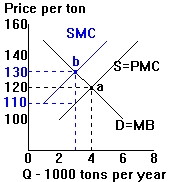
The accompanying table shows the supply and demand schedules for pulp paper in the country of Academia:
  Quantity (tons/year)
Price per ton Demanded Supplied
$150 1,000 7,000
140 2,000 6,000
130 3,000 5,000
120 4,000 4,000
110 5,000 3,000
100 6,000 2,000
a. Plot the demand and supply curves and show the equilibrium price and quantity.
    See diagram P = 120; Q = 4000 tons
b. Suppose that the production of pulp paper results in external pollution costs of $20 per ton produced. In your diagram, draw the social marginal cost (SMC) curve for pulp paper, and indicate the efficient quantity of pulp paper production.
    Efficient P = 130; Q=3000 tons
c. What policy would you recommend to reach the efficient quantity of pulp paper production? Illustrate the policy in your diagram. Under your policy, what price do buyers pay for pulp paper? What price do sellers receive?
    Impose a tax = $20, the size of the external cost. The tax lowers Q to 3000 tons. PBt rises to $130. PSt falls to $110.


8.

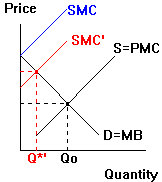
Suppose a state is considering a ban on the use of studded snow tires because of the damage they cause to highways. In making this decision, the state cares only about efficiency. Use a graph to illustrate a situation in which it is efficient to ban snow tires entirely. Now use your graph to illustrate a situation in which the use of studded snow tires should be reduced from the free-market level but not banned.
      The figure to the right shows a situation in which studded snow tires should be banned completely.  The demand curve intersects the supply curve at a positive quantity, Qo.  But if the damage to highways caused by the studded tires raises the social marginal cost curve (SMC) entirely above the demand curve, the efficient quantity is 0, and studded snow tires should be banned. If SMC = SMC' instead, then the efficient quantity is > 0.
     
 
MARKET POWER
 

9.

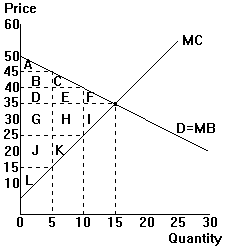
The diagram to the right represents the situation for a monopoly firm which is trying to decide what price to charge.
a. Compare producer surplus at the competitive price of $35 with producer surplus at a monopoly price of $40. How much does the producer gain? Explain where this gain comes from.
 
P Q CS PS
35 15 ABCDEF=$112.5 GHIJKL=$225
40 10 ABC=$50 DEGHJKL=$250
    The producer gains $25, the excess of transferred CS (DE=$50) over PS lost from reduced sales (I=$25).
b. How much consumer surplus do consumers lose as a result of the monopoly price? Explain why the loss in consumer surplus exceeds the gain in producer surplus.
    Consumers lose DEF=$62.5. Producer can't capture CS (F=$12.5) or PS (I=$25) on units no longer sold. That's the welfare loss to society as a whole.
c. Would the producer be even better off with a monopoly price of $45? Why or why not? Is Adam Smith correct when he says, "The price of monopoly is upon every occasion the highest which can be got"? Explain.
    No, worse off. PS=BDGL=$175. Even worse than P=35. Smith is wrong. Producers maximize PS, not price. Too high a price reduces PS by reducing sales volume too much.
 

10.

Evaluate the following statement: "Monopoly is good for producers but bad for consumers. The gains for producers offset the losses for consumers, so on balance there is no reason to think that monopoly is bad for the economy."
    Statement is wrong. Producer gains are less than consumer losses, so society as a whole loses. Shows up as welfare loss triangle in S&D diagrams.


11.

Answer the following questions based on the supplementary reading, "23 Colleges in East Adjust Aid to Avert Bidding for Students" (the article, "The Rebirth of the Ivy Cartel," contains an update of the situation):
a. A group of 23 select Eastern colleges have met privately to insure that a student seeking financial aid was offered roughly the same amount by each school in the group. What obstacles must be overcome by any group of sellers attempt to "collude" and "fix" prices?
    Obstacles include: (1) setting up agreement (for example, agreeing on price); (2) enforcement against "cheating"; competition from nonparticipants (like Oxy); substitutes (working, community college); non-price competition (changing the mix of grants vs. loans, work-study, etc.)
b. Which of the obstacles in question 1 are causing difficulty for this specific group of sellers? Cite evidence from the article for support.
    Enforcement against cheating is the main problem mentioned: Smith and Mt.Holyoke are "a crack in the dike"; they are offering slightly more aid. Not all the competitors are included.
c. Consider the last three paragraphs of the article.
(1) Do you agree with Pat Waters from Mount Holyoke that "the amount isn't large enough to make anyone change their mind"? If you disagree, why? If you agree, then why do you think Mount Holyoke would offer it?
    Disagree. If the aid increase doesn't "make anyone change their mind," then Mt. Holyoke is foolish to offer it.
(2) Does the financial aid officer quoted in passage A agree with Pat Waters? Explain briefly.
    Does not agree. Feels it does make a difference, or why "prefer Smith and Mt. Holyoke not to do it."
 
INCOME DISTRIBUTION
 

12.

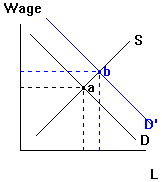
Mankiw, Chapter 18, Problems and Applications number 2.
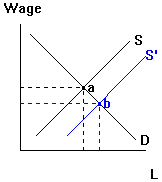
  a.  Demand for computers shifts right, raising computer prices and profits, so demand shifts up/right for computer labor too (lefthand diagram).
b.  Supply shifts right (righthand diagram).
c.  New factories raise the productivity of computer workers, so demand shifts up/right (lefthand diagram).
 

13.

Suppose you observe Worker A in Job A earning $45,000 and Worker B in Job B earning $30,000 per year. Explain how each of the following could help you account for the observed income differential. In each case, assume that everything about the two jobs and workers is similar except for the stated difference:
a. Worker A has 16 years of education, and Worker B has 12 years of education.
    Higher productivity --> greater demand; high opportunity cost --> restricted supply. Both push up the wage.
b. The work hours are 2 PM to 11 PM for Job A and 8 AM to 5 PM for Job B.
    Bad hours (nonpecuniary factor) --> restricted supply, pushing the wage up.
c. Worker A is a man; Worker B is a woman.
    Economic discrimination (customer discrimination or crowding model) can account for this.