The efficiency and equity effects of subsidies
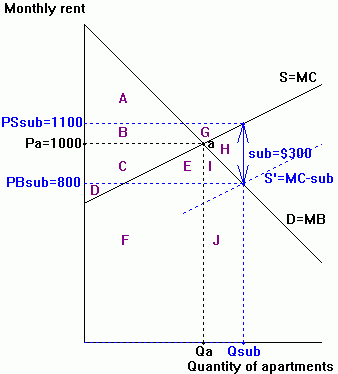
The diagram below illustrates the impact of a $300 per month subsidy on apartment rentals.
 |
To do:
Step 1: Complete column d of the table below. You can do it either of two
ways:
(1) Focus directly on the changes caused by the subsidy and
enter that information in column d.
(2) Fill in column c with the after-subsidy information
first, then compare columns b and c to complete column d.
| a | b | c | d |
| Before subsidy | After subsidy | Change | |
| 1. Equilibrium Quantity (Q) | Qa | Qsub | Qsub - Qa |
| 2. Price paid by Buyers (PB) | $1,000 | ||
| 3. Price received by Sellers (PS) | $1,000 | ||
| 4. Consumer Surplus (CS) | AB | ||
| 5. Producer Surplus (PS) | CD | ||
| 6. Government Revenue (GR) | 0 | ||
| 7. Change in Social Welfare | |||
Step 2: In the diagram, shade in the following changes resulting from the subsidy, and then draw a bold outline around the change in social welfare