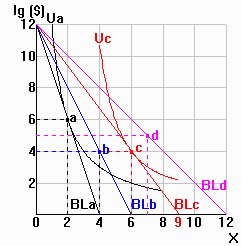
| Consider the sequence of optimal
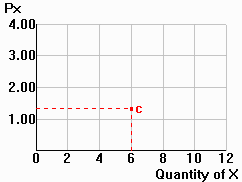
points as a decline in the price of x moves you from a to d in the diagram to the right. Step 1: Add indifference curves Ub and Ud to the top diagram. The Price Consumption Curve (PCC) Step 2: Link the optimal consumption points in the top diagram. This is the price consumption curve (PCC). Consumer Demand Step 3: Use information from the indifference curve/budget line diagram to complete the following table:
Step 4: In the lower right hand panel, plot the consumer's demand curve. (Note: this analysis works basically the same if you have a specific good Y on the vertical axis instead of income spent on other goods (Ig). The key difference is that the demand curve has Px/Py on the vertical axis instead of just Px.) (Available online (Java): PCC and demand geometry) |
  |
||||||||||||||||||||||||||||||