
| Jim Whitney | Economics 101 |
Based on the article, "Milk Prices to Rise; Southland to Be Hit Hardest." Los Angeles Times, September 25, 1997.
Part A:
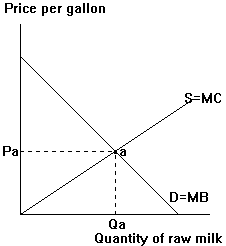
Step 1: In the lefthand diagram below, illustrate
the consequence of the events cited in Passage B of the article. Label
the new free-market price as PB.
Step 2: Suppose you were a state government regulator
of raw milk prices. Indicate in your diagram the price you would recommend
for raw milk after the events of Passage B.
Step 3: How does the price you recommended compare
to the free-market price you indicated in Step 1? Is government regulation
actually necessary to establish that price? Why or why not?
Step 4: Now add a price floor to your diagram which illustrates the likely implications of Passage A of the article. Label the price floor PF. Comparing PB and PF: Use "\\\" to shade in the consumer surplus lost, "///" to shade in the producer surplus lost, and "|||" to shade in the producer surplus gained.
Part B:
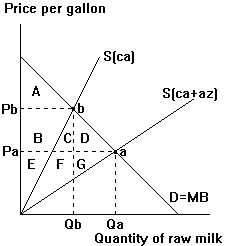
The righthand diagram below illustrates the California raw milk
market with potential supply from both California and Arizona producers.
Step 1: When both producers supply the market:
consumer surplus=______; producer surplus=______; the portion of the total
producer surplus going to California suppliers=______
Step 2: Now indicate the consequences of Passage
C in the article:
Does consumer surplus rise or fall? ______ By how much?
______
Does the producer surplus of California suppliers rise or fall? ______
By how much? ______

